

Facebook and Instagram ADS
Analyze your ADS performances
When it comes to campaigns, the question that customers often ask us is how much revenue will increase.
Answering is practically impossible. There are many factors that contribute to the success or failure of an online promotion campaign and be wary of those who promise a certain increase in terms of percentages or sales estimates.
However, it is understandable that those who are preparing to kick off a marketing operation want to understand and evaluate the results to decide if and how much it is worth investing.
We therefore decided to devote some time to research, to identify data online that can facilitate an estimate that can motivate and determine the budget.
In this article we will focus on Facebook, one of the main online advertising platforms currently available.
Why advertise on Facebook?
The numbers speak for themselves: Facebook has more than two billion registered users worldwide. In Italy, over 29 million people are registered on this social network.
To register, you must enter your gender, age, place of residence and origin. You can also indicate other information such as your job title, family and personal ties, interests (favorite music, books, movies).
The powerful Facebook algorithms also memorize the activities carried out on the platform (shares, comments, likes) by tracing a very detailed preference profile for each user.
Facebook therefore allows not only to reach a very large audience, but also offers a unique targeting possibility, difficult to find in other platforms.
Let's review something!
Let’s do a very quick review of the most relevant terms regarding campaigns.
The CPA, or cost per action, is the indicator of the cost produced by Facebook users for each action they perform in relation to a sponsored post. This means that every time a user takes an action on an advertising campaign, the campaign budget is spent.
The CPC, or cost per click, is the cost indicator for each single click. It is calculated by dividing the total budget by the number of clicks generated. From this you can understand the efficiency of a campaign and how much involvement it is able to create.
The CPR, or cost per result, indicates the amount spent to achieve the objectives of the campaign. It is calculated by dividing the amount spent by the number of results generated. it is useful to consult to check and compare the performance of the different campaigns and therefore understand which is more optimized.
The CPI, or cost per impression, is the cost of each individual impression. Impressions are the views of your ad on the homepage or on a page. You then spend your budget every time an ad is seen and it is calculated by dividing the total amount by the number of impressions. It is usually used to create awareness.
When setting up a campaign, you can decide, based on your marketing objectives, which actions you want to pay for. Facebook also allows you to decide whether to pay per impression (every time an ad is displayed on the homepage), per click (every time you click on an ad), per action (every time a predetermined action is performed, such as a registration, a request for information or a purchase).
But what about your ADS?
It is often difficult to tell if a campaign is performing well.
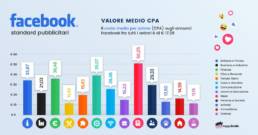
For this Facebook provides some data that can help us to evaluate the results more correctly. Each sector has its own dynamics and logic, but it is possible to have an average estimate of the costs per action.
This graph (re-interpretation of the study done by WordStream), clearly indicates the values in euro of the cost per share for different types of business.
But how is it possible to have a lower CPA?
The Facebook algorithm assigns a relevance score (or relevance score) for each advertising content (from 1 to 10).
If the score is high, this means that the content is relevant to the audience and therefore is more likely to appear on the homepage than other ads targeting the same audience but with a lower score.
The relevance score is assigned based on the positive or negative interactions generated by the sponsored posts. If the content is liked and relevant, it is easier for users to comment on it, share it or like it. Otherwise it is possible for users to hide the advertisement.
Relevance score is only accessible when a post has reached a reach of at least 500 people. Based on the ranking achieved, you can get an idea of how a campaign is going. In general, a campaign works well when it has a score higher than 6.
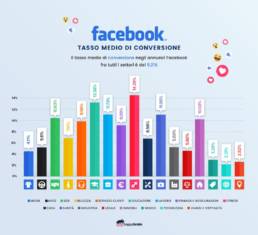
Another thing to consider in this type of analysis is the conversion rate. This is a percentage that indicates the average number of conversions that were generated by interacting with an ad and can be obtained by dividing the number of conversions by the total number of interactions with a sponsored post. It then calculates how many times a user who views an advertisement fulfills the optimization goal for which it was created.
The conversion rate varies greatly depending on the type of product you sponsor. If the products are more expensive or highly regarded they will have a lower conversion rate than low priced products or a lower consideration.
It is also necessary to take into account what type of conversion is being analyzed. Conversion is not just a sale, it could also mean a click, view, call, or record.
According to the latest available data, the average conversion rate across all sectors worldwide is 9.21%. The one relating to sales, on the other hand, is around 1-2%.
When setting up a campaign, Facebook lets you choose how much to invest. The more money you invest, the more people are reached.
Based on an average of the data recorded for an ad’s industry and target audience, Facebook offers a rough estimate of how many impressions and conversions can be achieved with your daily budget.
Through some complex algorithms Facebook is able to independently rotate the ads to optimize the results and, if necessary, adapt the budget at particular times of the day. For example, it may decide to spend up to 20% more on a day when the dynamic auction market is more fertile, but never exceeding the total budget threshold.
Check also this!
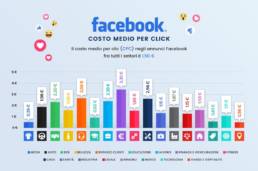
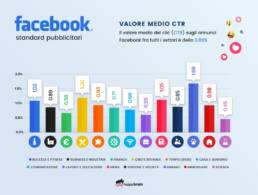
Here’s another little help. These two graphs show the average cost per click, (i.e. the price paid for each click on an ad) and the ctr, (i.e. the number of times a user who has already seen a page, returns to it to consult it. again), divided by sector.
We recommend that you also check the values of these parameters, especially if you have chosen to run campaigns with the aim of bringing visits to the site.
If you want some other advice, don’t miss this article!
If we have been useful to you, talk about us
Related post

Mobile marketing: what it is and why it’s strategic
Discover why mobile marketing has become the heart of digital strategies. In…

The difference between B2B and B2C E-commerce: two worlds, two strategies
B2B and B2C are two fundamentally different e-commerce models in terms of…

App Monetisation: effective strategies for turning a project into a sustainable business
Finding out how to monetise an app is essential to turning it into a…